Grid

그리드

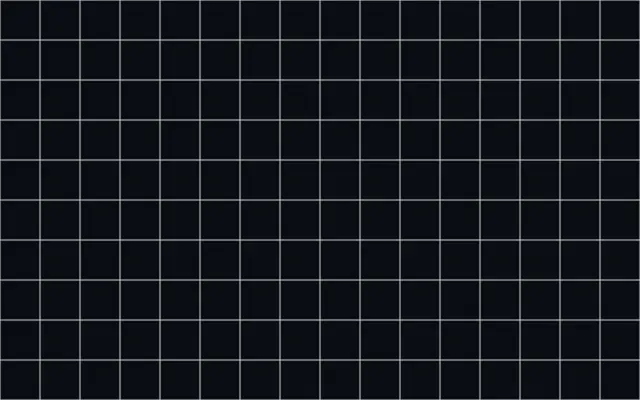
Evenly spaced lines cross to divide the canvas into a regular grid.

Also known as: Grid격자

Moves in browsers that support WebGPU

This device could not render the demo — showing a still

React
// Renders only in browsers with WebGPU.
import { Shader, Grid } from 'shaders/react'

export default function ShaderEffect() {
  return (
    <Shader style={{ width: '100%', height: 320 }} disableTelemetry>
      <Grid />
    </Shader>
  )
}
Vue
<!-- Renders only in browsers with WebGPU. -->
<script setup lang="ts">
import { Shader, Grid } from 'shaders/vue'
</script>

<template>
  <Shader style="width: 100%; height: 320px" :disable-telemetry="true">
    <Grid/>
  </Shader>
</template>
Svelte
<!-- Renders only in browsers with WebGPU. -->
<script>
  import { Shader, Grid } from 'shaders/svelte'
</script>

<Shader style="width: 100%; height: 320px" disableTelemetry>
  <Grid />
</Shader>
Solid
// Renders only in browsers with WebGPU.
import { Shader, Grid } from 'shaders/solid'

export default function ShaderEffect() {
  return (
    <Shader style={{ width: '100%', height: '320px' }} disableTelemetry>
      <Grid />
    </Shader>
  )
}
JavaScript
// Renders only in browsers with WebGPU.
// expects <canvas id="canvas" style="width:100%;height:320px"></canvas> on the page
import { createShader } from 'shaders/js'

const shader = await createShader(document.getElementById("canvas"), {
  components: [
    {
      type: 'Grid',
    }
  ]
}, { disableTelemetry: true })

Props · Grid

Changes apply to the demo above and to the code tabs. Descriptions come from the library registry (MIT).

NameValueDefaultRange / optionsDescription
colorLine Color#ffffff—The color of the grid lines
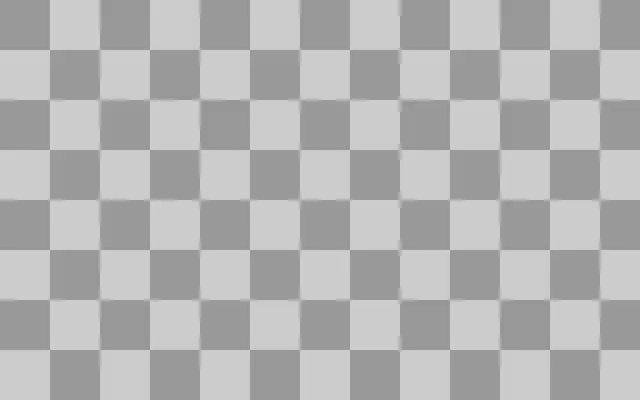
cellColorCell Colortransparent—Fill color of the cells (transparent = lines only). Pair with Variation for a tiled look.
cellsCells101 – 50 (step 1)Number of cells along the canvas height (cells stay square; the width fits as many as the aspect ratio allows)
thicknessThickness10 – 20 (step 0.1)Thickness of grid lines (normalized, 0.0-1.0)
rotationRotation00 – 360 (step 1)Rotation of the grid in degrees. At 45° this produces a crosshatch/diamond pattern.
softnessSoftness00 – 1 (step 0.01)Softness of the line edges (0 = crisp, 1 = very soft)
variationVariation00 – 1 (step 0.01)Per-cell random lightening/darkening of the cell fill color
colorSpaceColor Spacelinearlinear · oklch · oklab · hsl · hsv · lchColor space for color interpolation

Every component also takes blendMode · opacity · visible · maskSource/maskType · boundingBox · id

Like graph paper or coordinate lines on a map, the lines divide the canvas into regular cells. It can show a fine outline grid or tiles with filled cells.

`cells` sets the number of square cells along the canvas height, and increasing `thickness` makes the lines heavier. At 45 degrees, `rotation` produces a diamond-like crosshatch. Use `cellColor` to fill the cells and raise `variation` to vary their brightness.

`cellColor` is transparent by default, so only the lines appear. The generator needs no input layer; over an image, tune the cell spacing and line weight so the grid does not cover important details.

When to use

Use it for technical dashboards, map or blueprint backgrounds, and graph-paper-like workspaces. Avoid it where dense lines would overlap body copy or data.

Open as page ↗