열화상 맵

Heatmap

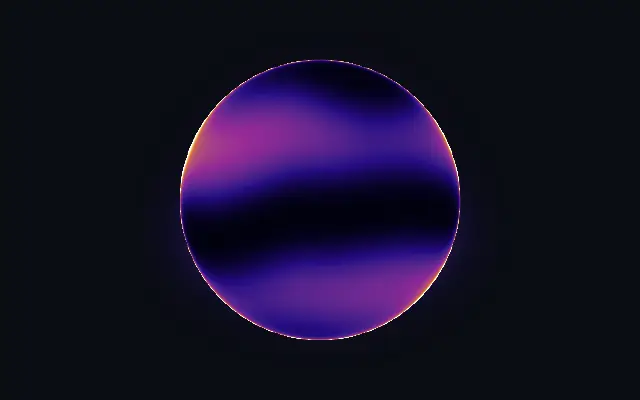
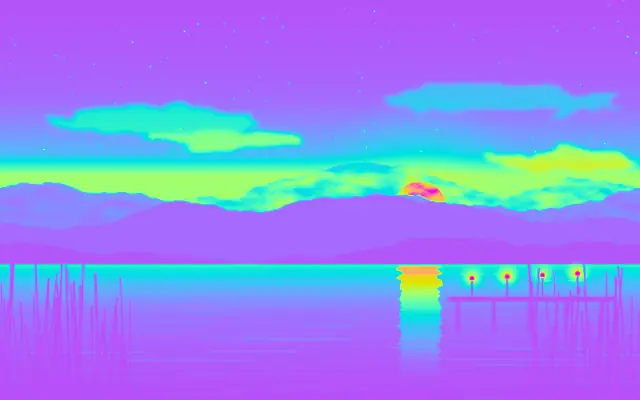
도형 안팎으로 흐르는 열의 색과 윤곽을 열화상 카메라처럼 표현합니다.

다른 이름: HeatmapThermal mapThermal camera effect

WebGPU 를 지원하는 브라우저에서 움직입니다

이 기기에서는 데모를 그리지 못해 정지 화면을 보여 줍니다

React
// WebGPU 를 지원하는 브라우저에서만 그립니다.
import { Shader, Heatmap } from 'shaders/react'

export default function ShaderEffect() {
  return (
    <Shader style={{ width: '100%', height: 320 }} disableTelemetry>
      <Heatmap />
    </Shader>
  )
}
Vue
<!-- WebGPU 를 지원하는 브라우저에서만 그립니다. -->
<script setup lang="ts">
import { Shader, Heatmap } from 'shaders/vue'
</script>

<template>
  <Shader style="width: 100%; height: 320px" :disable-telemetry="true">
    <Heatmap/>
  </Shader>
</template>
Svelte
<!-- WebGPU 를 지원하는 브라우저에서만 그립니다. -->
<script>
  import { Shader, Heatmap } from 'shaders/svelte'
</script>

<Shader style="width: 100%; height: 320px" disableTelemetry>
  <Heatmap />
</Shader>
Solid
// WebGPU 를 지원하는 브라우저에서만 그립니다.
import { Shader, Heatmap } from 'shaders/solid'

export default function ShaderEffect() {
  return (
    <Shader style={{ width: '100%', height: '320px' }} disableTelemetry>
      <Heatmap />
    </Shader>
  )
}
JavaScript
// WebGPU 를 지원하는 브라우저에서만 그립니다.
// <canvas id="canvas" style="width:100%;height:320px"></canvas> 가 페이지에 있어야 한다
import { createShader } from 'shaders/js'

const shader = await createShader(document.getElementById("canvas"), {
  components: [
    {
      type: 'Heatmap',
    }
  ]
}, { disableTelemetry: true })

속성(props) · Heatmap

값을 바꾸면 위 데모와 코드 탭에 바로 반영됩니다. 설명은 라이브러리 레지스트리의 영어 원문(MIT)입니다.

이름값기본값범위·선택지설명(원문)
originOrigin코드에서 지정center—Reference edge the center position is measured from (center default). Lets you pin the shape relative to a corner or the canvas centre.
centerCenter
x0.5y0.5
{"x":0.5,"y":0.5}x, y: 0 – 1Center position of the heatmap shape
scaleScale10.1 – 3 (step 0.01)Scale of the heatmap shape (1 = default size)
rotationRotation00 – 360 (step 1)Rotation of the heatmap shape in degrees
colorAColor A#02010f—Cold color (used when no gradient stops are set)
colorBColor B#f9e25f—Hot color (used when no gradient stops are set)
stopsColors코드에서 지정[{"color":"#02010f","position":0},{"color":"#2a0a8a","pos…—Multi-stop gradient colors (overrides Color A / Color B when set)
colorSpaceColor Spaceoklablinear · oklch · oklab · hsl · hsv · lchColor space for the heat ramp interpolation
innerGlowInner Glow0.40 – 1 (step 0.01)Heat filling the inside of the shape
outerGlowOuter Glow0.20 – 1 (step 0.01)Heat radiating beyond the silhouette
contourContour0.50 – 1 (step 0.01)Heat concentrated along the shape boundary
angleAngle900 – 360 (step 1)Direction the heat waves travel, in degrees
speedSpeed10 – 4 (step 0.01)Speed of the flowing heat. 0 pauses.
shapeShape코드에서 지정{"type":"sphere3D","radius":0.35}—Serialized shape configuration (JSON)
shapeSdfUrlshapeSdfUrl코드에서 지정—URL to a pre-generated SDF .bin file
shapeTypeshapeType코드에서 지정—Active SDF shape type

모든 컴포넌트 공통: blendMode · opacity · visible · maskSource/maskType · boundingBox · id

열화상 화면처럼 도형 안쪽은 따뜻하게 빛나고, 열의 흐름이 윤곽 바깥까지 번집니다.

`innerGlow`는 내부의 열을, `outerGlow`는 바깥으로 퍼지는 열을 조절합니다. `contour`를 높이면 열이 경계에 더 모이고, `angle`은 열파가 움직이는 방향을 바꿉니다. `speed`는 흐르는 속도를 조절합니다.

자체 도형 위에서 장식적인 열 색을 만들며 단색 배경에 두면 움직임이 잘 보입니다. 측정값을 보여 주는 의료·산업용 열 데이터로 오해되지 않도록 실제 계측 화면에는 사용하지 마세요.

언제 쓰나

온도 테마 장식, 뜨거운 상태를 강조하는 그래픽, 열화상풍 배경에 어울립니다. 실제 센서값이나 진단 결과처럼 정확한 데이터를 전달해야 할 때는 피하세요.

페이지로 열기 ↗